CanvasJS StockCharts provides you with a powerful JavaScript StockChart library for creating advanced financial charts for your web pages & applications. StockCharts work well with all the popular Technologies & Frameworks like React, Angular, jQuery, PHP, etc.
|
Chrome |
Edge |
Firefox |
Safari |
IE9+ |
IE8 |
|---|---|---|---|---|---|
| 4+ ✔ | 12+ ✔ | 3.6+ ✔ | 4+ ✔ | 9+ ✔ | 8 ✔ |
- Official Website
- JavaScript StockCharts Demo
- Download CanvasJS
- StockChart Documentation
- StockChart Support Forum
There are multiple ways to install CanvasJS StockChart to your web-app. You can directly add script-tag to include CanvasJS StockCharts from our CDN or download it from official site or install it from NPM registry. Please refer documentation page for more information.
npm install @canvasjs/stockcharts
See npm documentation to know more about npm usage.
You can access CanvasJS StockCharts from our CDN directly.
<script src="https://cdn.canvasjs.com/canvasjs.stock.min.js"></script>
You can download the JavaScript stockchart library along with examples from our official download page. Save it in your project directory & add it in your application.
<script src="canvasjs.stock.min.js"></script>
Once you have installed the package, you can start using CanvasJS StockCharts in your project. CanvasJS StockCharts can be imported using different module formats like AMD, CommonJS, etc.
//Load CanvasJS StockCharts
import * as CanvasJS from "@canvasjs/stockcharts";
//var CanvasJS = require("@canvasjs/stockcharts");
Define container for the stockchart.
<div id="stockChartContainer"></div>
Create & Render the stockchart.
//Create StockChart
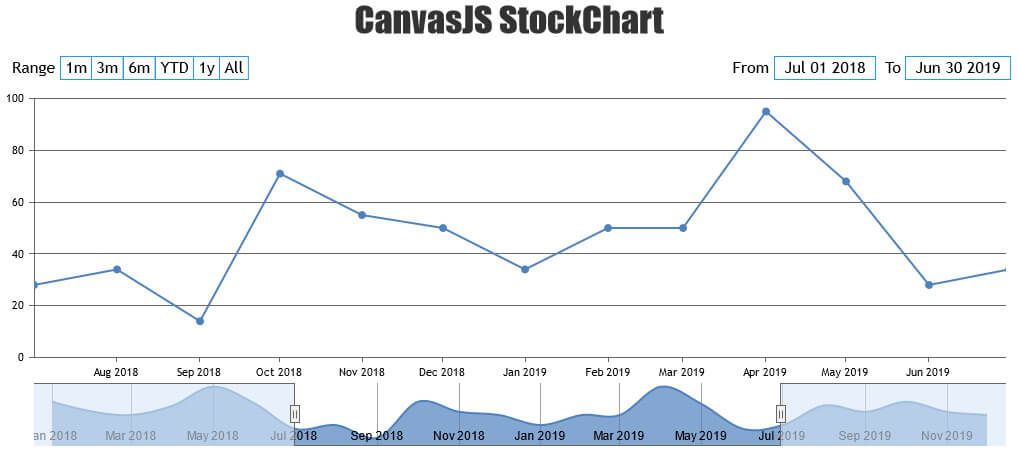
var stockChart = new CanvasJS.StockChart("stockChartContainer", {
//StockChart Options - Check https://canvasjs.com/docs/stockcharts/stockchart-options/
title: {
text: "CanvasJS StockChart"
},
charts: [{
data: [{
type: "line",
dataPoints: [
{ x: new Date("2018-01-01"), y: 71 },
{ x: new Date("2018-02-01"), y: 55 },
{ x: new Date("2018-03-01"), y: 50 },
{ x: new Date("2018-04-01"), y: 65 },
{ x: new Date("2018-05-01"), y: 95 },
{ x: new Date("2018-06-01"), y: 68 },
{ x: new Date("2018-07-01"), y: 28 },
{ x: new Date("2018-08-01"), y: 34 },
{ x: new Date("2018-09-01"), y: 14 },
{ x: new Date("2018-10-01"), y: 71 },
{ x: new Date("2018-11-01"), y: 55 },
{ x: new Date("2018-12-01"), y: 50 },
{ x: new Date("2019-01-01"), y: 34 },
{ x: new Date("2019-02-01"), y: 50 },
{ x: new Date("2019-03-01"), y: 50 },
{ x: new Date("2019-04-01"), y: 95 },
{ x: new Date("2019-05-01"), y: 68 },
{ x: new Date("2019-06-01"), y: 28 },
{ x: new Date("2019-07-01"), y: 34 },
{ x: new Date("2019-08-01"), y: 65 },
{ x: new Date("2019-09-01"), y: 55 },
{ x: new Date("2019-10-01"), y: 71 },
{ x: new Date("2019-11-01"), y: 55 },
{ x: new Date("2019-12-01"), y: 50 }
]
}]
}],
navigator: {
slider: {
minimum: new Date("2018-07-01"),
maximum: new Date("2019-06-30")
}
}
});
//Render StockChart
stockChart.render();
Commercial use of CanvasJS StockChart requires a commercial license. Without a commercial license you can use it for evaluation (or demonstrations/testing) purposes. Students, Educational Institutions, Personal Websites using CanvasJS for non-commercial purposes are qualified for the free license. Check out License Page to know more about licenses.