
Time format ticks
📊 Format your time axis ticks in a pretty way
A little bit very horrible demo page

![]()
⚙️ Installing
yarn add time-format-ticksor
npm install time-format-ticks --save📊 Description
Given a list of timestamps, it recognizes the time interval necessary to represent the dates (15 seconds, minute,
30 minutes, hourly, daily, weekly, monthly, quarterly or yearly) and formats the ticks accordingly.
Two possible formats (primary and secondary) are associated with each time interval which can be used to format the
current tick.
Primary format was designed to represent the value (the date corresponding to the tick) in a more exhaustive and
detailed way, while the secondary format represents the value in a concise way.
Primary tick format is used for the first tick and when something happens between the last and the current ticks based
on the time interval.
For example if time interval is daily, I'm probably interested to see a primary tick on the first tick and every
time a ticks rapresents a date which month or year is changed respet to the previous tick.
The remaining ticks are formatted using the secondary format.
So I can describe this logic using this schema:
daily:
  primary: "MMM d"
  secondary: "d"

  primary:
    * first tick
    * change month
    * change year
  secondary:
    * otherwise
What does it mean?
Exactly the same described above: if time interval is daily, the primary format tick is MMM d, the secondary
format tick is d so the primary tick actually describes the date more precisely because it shows the month and day,
while the secondary format tick shows only the day.
The primary format tick is used on the first tick and when there is a change of month or year, in all the other cases
it's being used the secondary format tick.
Below there is a short diagram on how ticks are formatted:
15seconds:
  primary: "MMM d, pp"
  secondary: "pp"

  primary:
    * first tick
    * change day of month
    * change month
    * change year
  secondary:
    * otherwise

minute:
  primary: "MMM d, p"
  secondary: "p"

  primary:
    * first tick
    * change day of month
    * change month
    * change year
  secondary:
    * otherwise

30minutes:
  primary: "MMM d, p"
  secondary: "p"

  primary:
    * first tick
    * change day of month
    * change month
    * change year
  secondary:
    * otherwise

hourly:
  primary: "MMM d, hh a"
  secondary: "hh a"

  primary:
    * first tick
    * change day of month
    * change month
    * change year
  secondary:
    * otherwise

daily:
  primary: "MMM d"
  secondary: "d"

  primary:
    * first tick
    * change month
    * change year
  secondary:
    * otherwise

weekly:
  primary: "eee, MMM d"
  secondary: "eee"

  primary:
    * first tick
    * change week
    * change year
  secondary:
    * otherwise

monthly:
  primary: "MMM yyyy"
  secondary: "MMM"

  primary:
    * first tick
    * change year
  secondary:
    * otherwise

quarterly:
  primary: "QQQ ''yy"
  secondary: "QQQ"

  primary:
    * first tick
    * first quarter
  secondary:
    * otherwise

yearly:
  primary: "yyyy"
  secondary: "yyyy"

  primary:
    * never
  secondary:
    * otherwise
Note: as you can see in the above diagram, the weekly time interval doesn't exist. It works as daily but it
shows the day names instead of the day numbers and user can choose the format using the showDayName option.
Note: if the dataset has only one datum, we show the tick in the most detailed way possible using 15 seconds time
interval.
Where:
MMM: short name of the month (ie. Jan-Dec)d: day of the month (ie. 1-31)pp: long localized time (ie. 12:00:00 AM)p: long localized time (ie. 12:00 AM)hh: hour 1-12a: AM, PMeee: local day of week (ie. Mon, Tue, Wed, ..., Su)yyyy: calendar year (ie. 2010, 2017)yy: calendar year (ie. 10, 17)QQQ: quarter (ie. Q1, ..., Q4).
primary and secondary specify the format of the formatted tick. The format of this string is based on Unicode
Technical Standard #35.
More info on the date-fns documentation.
🐟 Customization
You can customize both the primary and the secondary format. You can also, as said before, chose to show the day as
number or as day name. Also, you can change the Locale.
All of those things are possible using the Options object.
Change the formats
If you prefer to show hours using 24h and not 12h as default, you can descbribe the formats in this way:
const options = formats: hourly: primary: 'MMM d, HH:mm' secondary: 'HH:mm' If you prefer to show years as 2-digit instead of 4-digit for yearly time interval:
const options = formats: yearly: primary: 'yy' secondary: 'yy' An infinte number of combinations are possible, the important thing is to use the [Unicode Technical Standard
35](https://www.unicode.org/reports/tr35/tr35-dates.html#Date_Field_Symbol_Table).
Choose how to show days
If you prefer to show day as day name instead of day number, you can set the showDayName option to true and [1, 2, ..., 31] become [Monday, Tuesday, ..., Sunday].
Change Locale
Default locale is english-US but the user can choose the one he prefers. The available locale objects are those
supported by date-fns.
Here is the list.
Basically by changing the locale only the language of the labels change.
To change the formats of the labels according to a locale the only possibility is to add a new formats. This is an
open problem.
Each option value is optional.
📷 Screenshots
15seconds
const ticks = 2020 11 10 23 59 15 2020 11 10 23 59 30 2020 11 10 23 59 45 2020 11 11 0 0 0 2020 11 11 0 0 15 2020 11 11 0 0 30 2020 11 11 0 0 45const formatter = 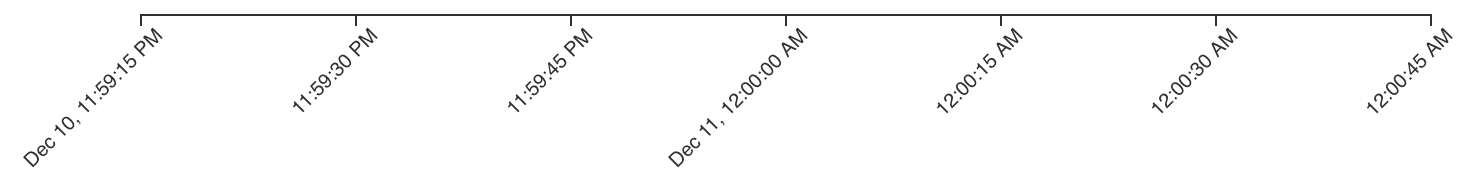
minute
const ticks = 2020 4 21 23 47 0 2020 4 21 23 58 0 2020 4 21 23 59 0 2020 4 22 0 0 0 2020 4 22 0 1 0 2020 4 22 0 2 0 2020 4 22 0 3 0 2020 4 22 11 58 0 2020 4 22 11 59 0 2020 4 22 12 0 0 2020 4 22 12 1 0 0 2020 4 22 12 2 0const formatter = 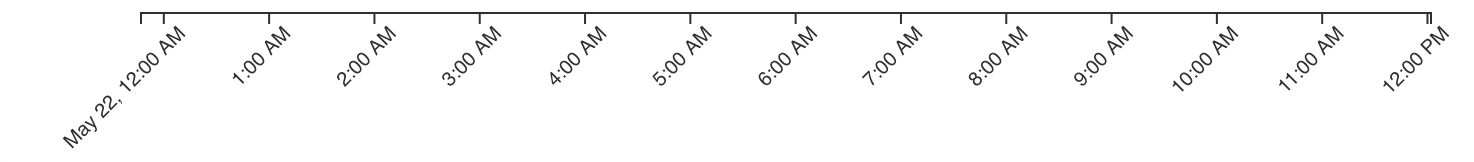
30minutes
const ticks = 2020 11 10 22 30 2020 11 10 23 0 2020 11 10 23 30 2020 11 11 0 0 2020 11 11 0 30 2020 11 11 1 0 2020 11 11 1 30const formatter = 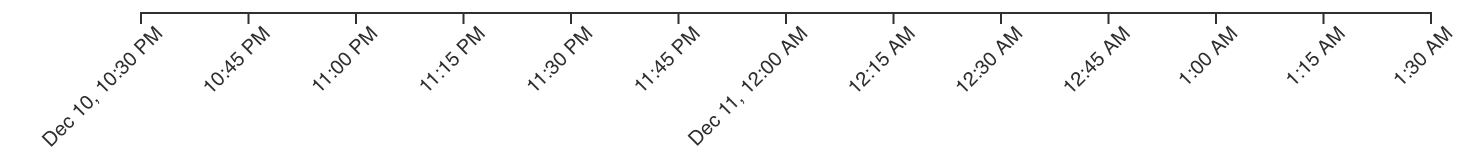
hourly
const ticks = 2020 11 10 22 0 2020 11 10 23 0 2020 11 11 0 0 2020 11 11 1 0 2020 11 11 2 0 2020 11 11 3 0 2020 11 11 4 0 2020 11 11 11 0 2020 11 11 12 0 2020 11 11 13 0 2020 11 11 14 0 2020 11 11 15 0const formatter = 
hourly with custom format
const ticks = 2020 11 10 22 02020 11 10 23 02020 11 11 0 02020 11 11 1 02020 11 11 2 02020 11 11 3 02020 11 11 4 02020 11 11 11 02020 11 11 12 02020 11 11 13 02020 11 11 14 02020 11 11 15 0const options = formats: 'hourly': primary: 'MMM d, HH:mm' secondary: 'HH:mm' const formatter = 
daily
const ticks = 2019 11 30 2019 11 31 2020 0 1 2020 0 2 2020 0 3 2020 0 4 2020 0 5 2020 0 30 2020 0 31 2020 1 1 2020 1 2 2020 1 3const formatter = 
weekly
const ticks = 2020 0 27 2020 0 28 2020 0 29 2020 0 30 2020 0 31 2020 1 1 2020 1 2 2020 1 3 2020 1 4 2020 1 5 2020 1 6 2020 1 7const options = showDayName: true const formatter = 
monthly
const ticks = 2018 9 2018 10 2018 11 2019 0 2019 1 2019 2 2019 3 2019 10 2019 11 2020 0 2020 1 2020 2const formatter = 
monthly with custom Locale
const ticks = 2018 9 2018 10 2018 11 2019 0 2019 1 2019 2 2019 3 2019 10 2019 11 2020 0 2020 1 2020 2const options = localeObject: frLocaleObject const formatter = 
quarterly
const ticks = 2017 0 2017 3 2017 6 2017 9 2018 1 2018 4 2018 7 2019 0 2019 5 2019 7 2019 10 2020 0const formatter = 
yearly
const ticks = 1977 0 1978 0 1979 0 1980 0 1981 0 1982 0 1983 0 2015 0 2016 0 2017 0 2018 0 2019 0const formatter = 
🐝 API
getFormatter(ticks: Tick[], options?: Options): Formatter
It returns a formatter that you can pass as input to axis.tickFormat(formatter).
For more information see the offical d3 documentation.
Params are:
ticks: is an array of timestampsoptions(optional): is an object with this structure, each attribute is optional:
showDayName: false localeObject: enUSLocaleObject formats: '15seconds': primary: 'MMM d, pp' secondary: 'pp' 'minute': primary: 'MMM d, p' secondary: 'p' '30minutes': primary: 'MMM d, p' secondary: 'p' 'hourly': primary: 'MMM d, hh a' secondary: 'hh a' 'daily': primary: 'MMM d' secondary: 'd' 'weekly': primary: 'eee, MMM d' secondary: 'eee' 'monthly': primary: 'MMM yyyy' secondary: 'MMM' 'quarterly': primary: `QQQ ''yy` secondary: 'QQQ' 'yearly': primary: 'yyyy' secondary: 'yyyy' computeTimeIntervalName(ticks: Tick[]): TimeInterval)
Given the timestamps array ticks, it returns a string representing the time interval necessary to show in the best way
your dates.
The possible time interval values are:
15secondsminute30minuteshourlydailymonthlyquarterlyyearly
isTickPrimary(tick: Tick, tickIndex: number, interval: TimeInterval, showDayName: boolean): boolean
Returns true if the tick is a primary tick, false otherwise.
Params are:
tick: Tick: a single timestamp valuetickIndex: number: the index of the tickinterval: TimeInterval: the time insterval that suits your datashowDayName: boolean: if interval isdaily, you can setshowDayNameastrueif you want to show days as string,falseotherwise. In all the other cases, doesn't matter what the value of this variable is. Probably I'll work on it. This function is useful if you want, for example, set a different style to primary and secondary ticks: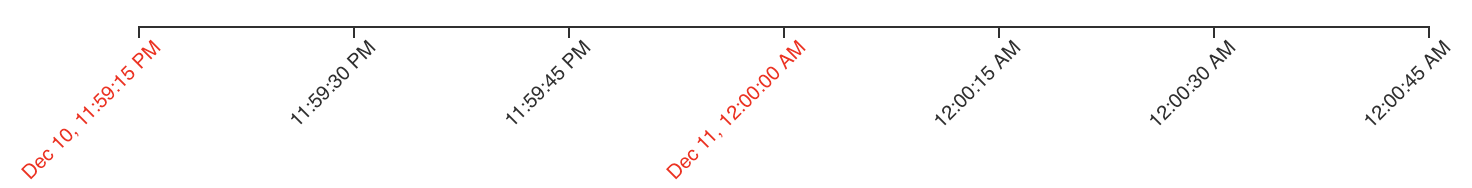
🦶 Example
// create an array of timestampsconst dates = 2020 11 10 23 59 15 2020 11 10 23 59 30 2020 11 10 23 59 45 2020 11 11 0 0 0 2020 11 11 0 0 15 2020 11 11 0 0 30 2020 11 11 0 0 45// transform dates to timestampsconst ticks = dates // set width and height of your axisconst width = 800const height = 100const margins = top: 10 right: 40 bottom: 0 left: 60 // create the time scaleconst domain = const range = 0 width - marginsleft - marginsrightconst scale = // get the formatterconst formatter = // create the bottom axis generatorconst axisGenerator = // append axis to the DOMconst holder = holder The result is:
🙈 Demo page
A demo page is available here.