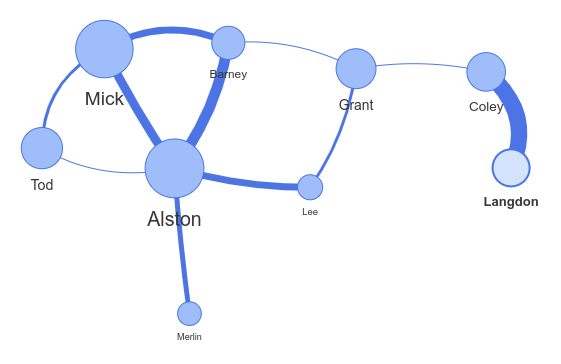
Network is a visualization to display networks and networks consisting of nodes and edges. The visualization is easy to use and supports custom shapes, styles, colors, sizes, images, and more. The network visualization works smooth on any modern browser for up to a few thousand nodes and edges. To handle a larger amount of nodes, Network has clustering support. Network uses HTML canvas for rendering.